Services
Business Intelligence & Dashboards
Turn live data into dashboards your team can read, explore, and act on.
The process
-
Data Sources
Connects to live databases, cloud warehouses, enterprise resource planning (ERP) systems, or spreadsheets.
-
Visualizations
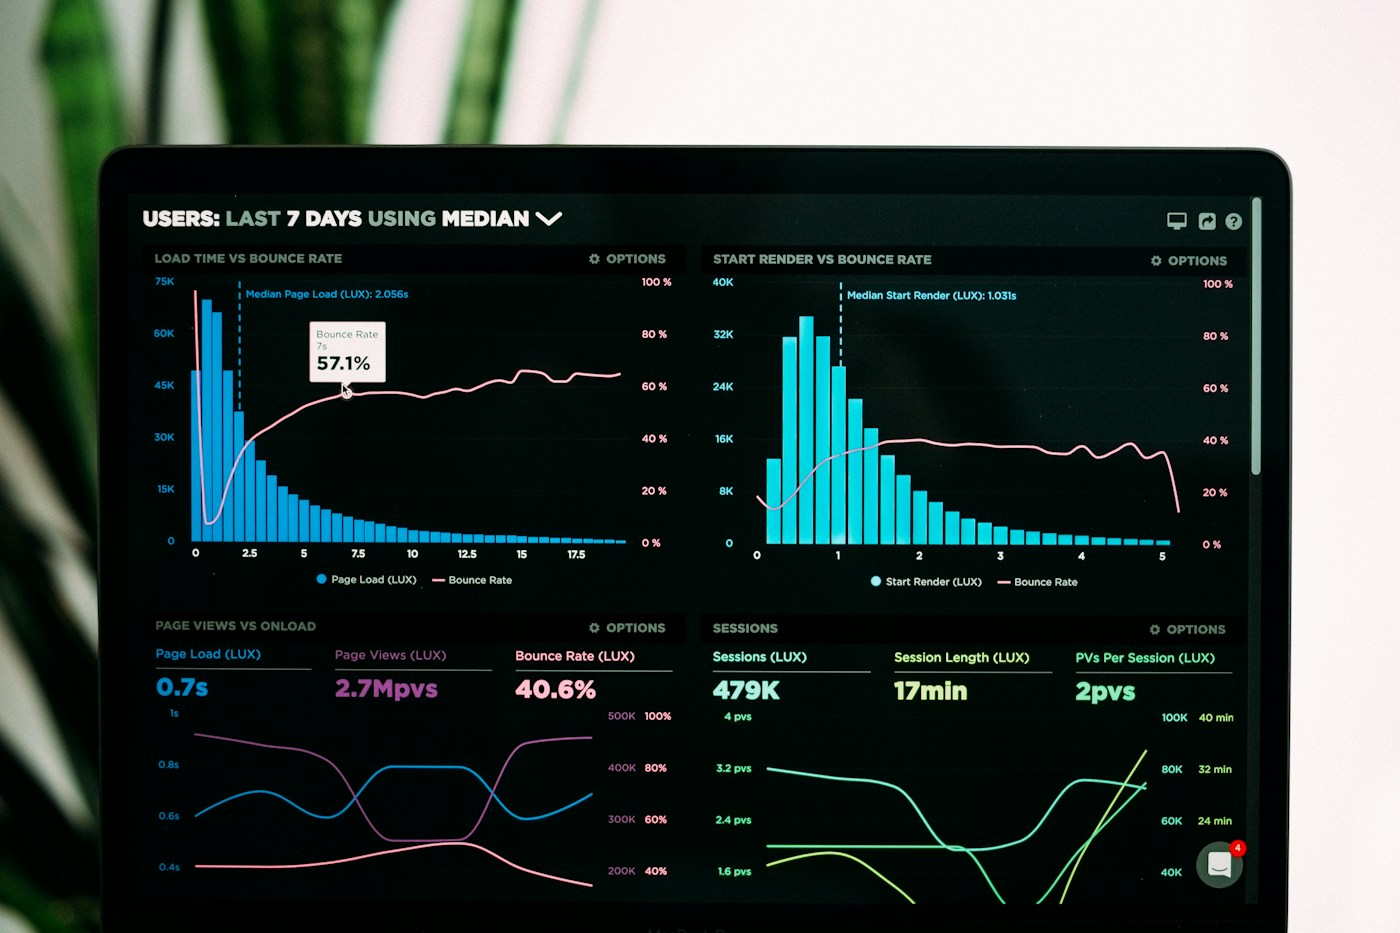
Uses charts, graphs, heatmaps, maps, and tables to turn raw data into a readable format.
-
Interactivity
Lets users filter dates, drill down into specific data points, and adjust views on demand.
-
AI & Automation
Features automated data refreshes, natural language querying, and anomaly detection.
 Unsplash
Talk to us


